Code
# Removing the First Row
data <- data[-1, ]This is a blog post about Literacy Rates in India. Welcome!

Any nation’s literacy rate is a key sign of its socio-economic development. The literacy rate in India is calculated by dividing the total number of literate people aged 7 or older by the total population aged 7 or older, then multiplying the result by 100. Literacy data is gathered every ten years through the census. This literacy rate informs about the percentage of the population proficient in reading and writing.
In this blog, we look at the differences in literacy rates between the 2001 and 2011 census periods across Indian states and union territories. The main goal is to check whether there have been any significant improvements in total literacy rates over the years and to examine the differences between rural and urban literacy rates. The analysis also aims to determine whether there is a notable gap between rural and urban literacy rates and whether the gap is narrow or wide.
Data Source
The data set was downloaded from the Kaggle Website called Govt Of India Literacy Rate. Firstly we logged into the Kaggle website using a gmail account then we looked for literacy rates of India released by the government. The website provides a csv file which is easy to download and then it was loaded in Rstudio using the read_csv function.
Data Dictionary
The data set has 8 variables, which include information about the percentage of literacy rates in India and the states and Union territories in India. It also calculates the rates for urban and rural populations for the years 2001 and 2011. The variables are:
India has 28 states and 8 union territories. States enjoys a more autonomy, managing local governance, education, health, and law enforcement, while union territories are typically governed by the central government. Some union territories, like Delhi and Puducherry, have partial statehood, allowing them to have their own legislatures with limited authority.
While the data set used in the analysis is from the 2001 and 2011 census, it only includes information for 7 Union territories. This is because Ladakh, the 8th Union territory, was not formed until 2019, after being separated from the state of Jammu and Kashmir. Therefore, Ladakh is not represented in the census data used for this analysis.
Data Cleaning
The data set used for the analysis is well-structured and does not contain any missing values. Additionally, the data is already in a tidy format, with each variable as a column and each observation as a row. However, a minor step was performed to prepare the data set for analysis:
Removing the First Row: The data set included a column where the literacy rates of India as a whole were provided. Since this analysis focuses on individual states and union territories, this row was removed to avoid any confusion and ensure consistency in the data.
# Removing the First Row
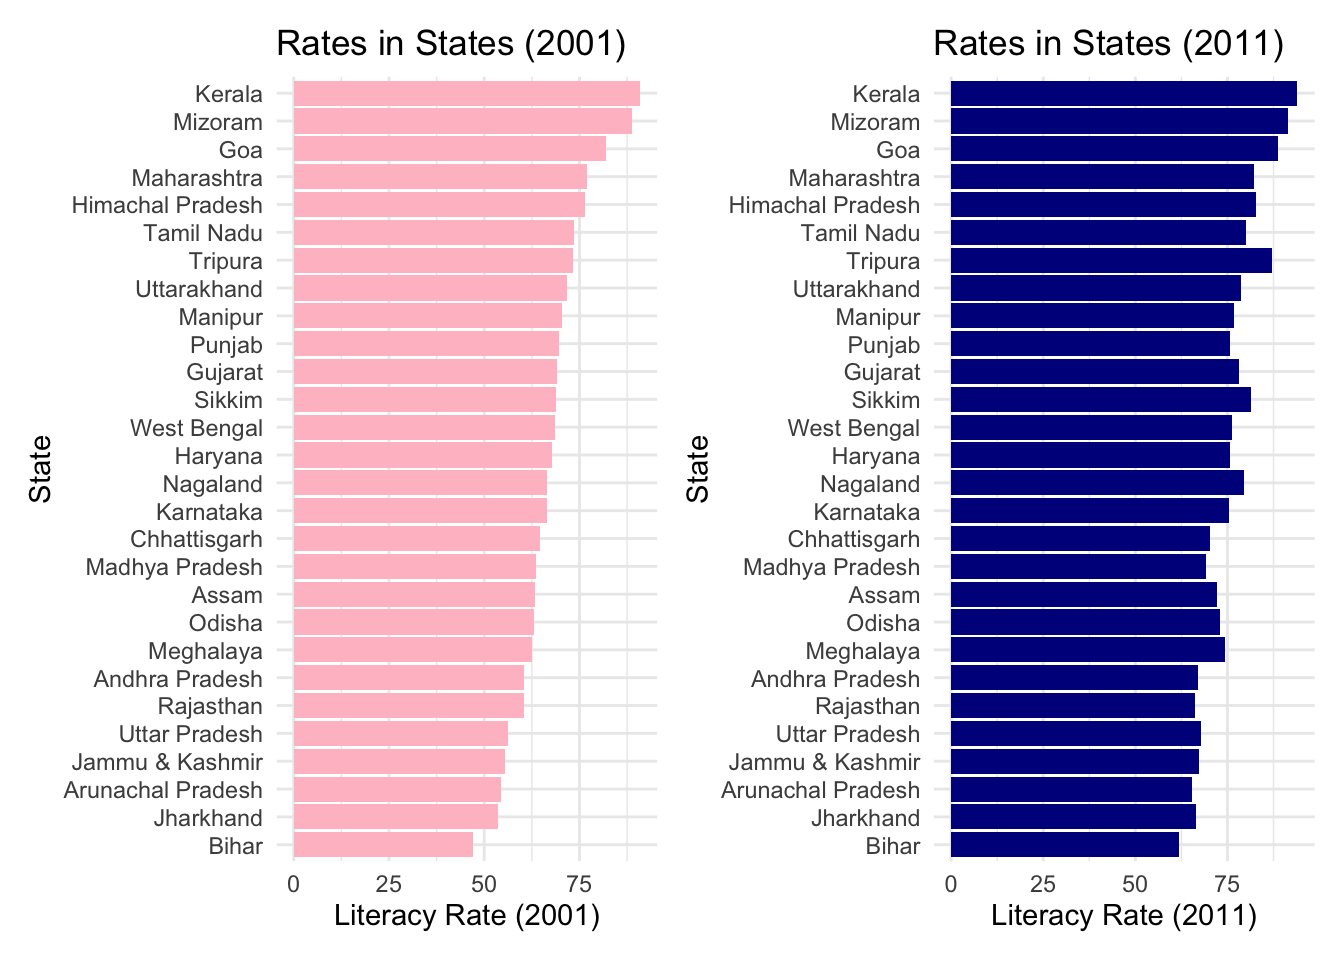
data <- data[-1, ]The plots in Figure 1 shows the total literacy rates across all states in India from the 2001 and 2011 censuses.
States like Kerala, Mizoram, and Goa consistently show high literacy rates across both 2001 and 2011.
States with lower literacy rates in 2001, such as Bihar and Jharkhand, show some improvement by 2011, although they continue to have lower literacy rates compared to other states.
Most states show an overall increase in literacy rates over the decade, indicating that educational policies and initiatives taken during this period may have had a positive impact.
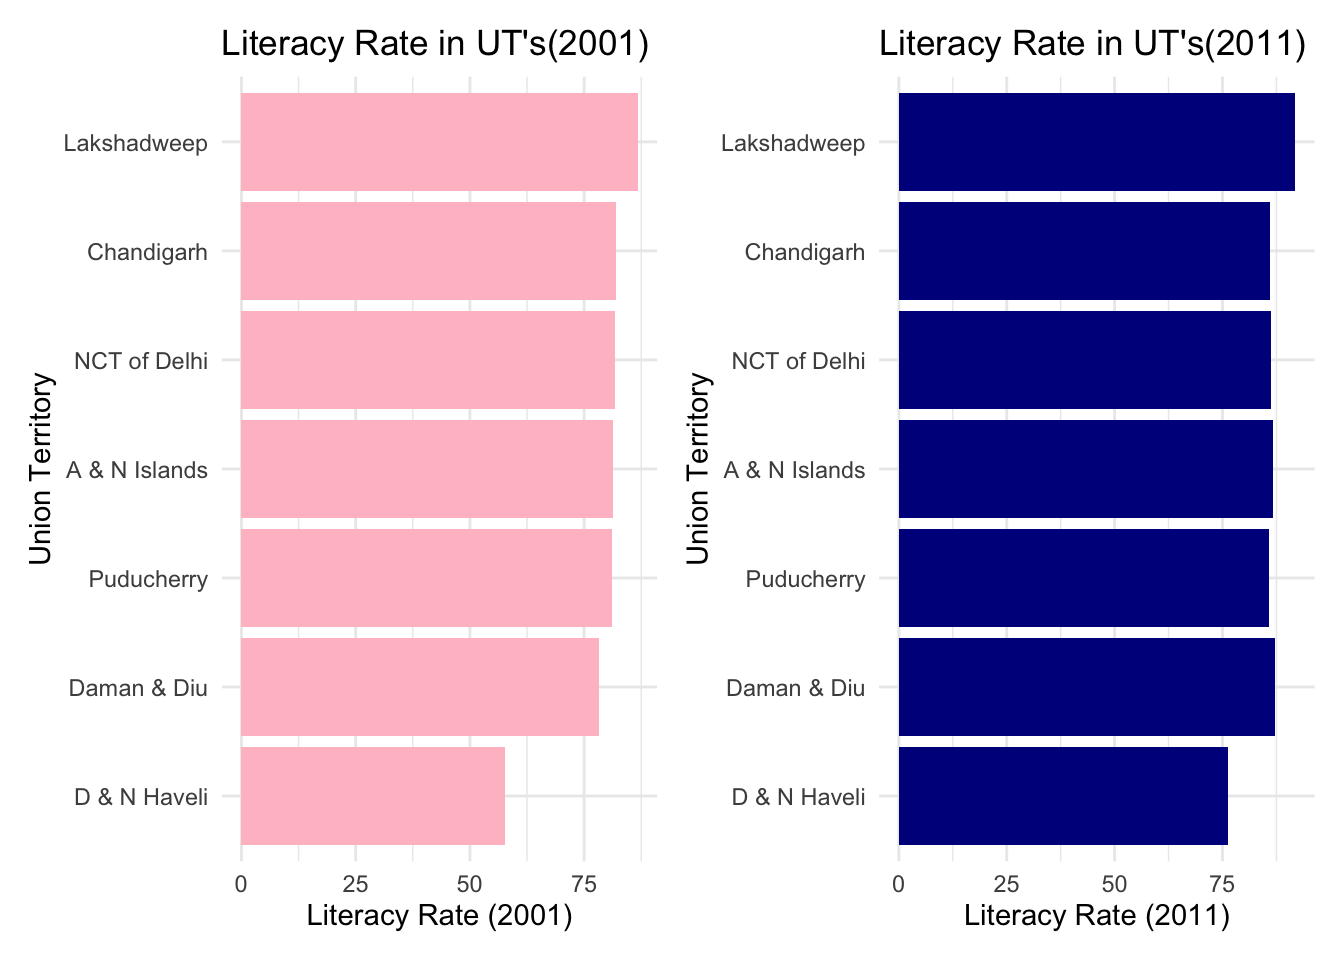
The plots in Figure 2 showcases the total literacy rates across all union territories in India from the 2001 and 2011 censuses.
Lakshadweep, Chandigarh, and NCT of Delhi consistently show high literacy rates in both 2001 and 2011.
Dadra and Nagar Haveli shows a significant improvement in literacy between 2001 and 2011 but continues to fall behind the other union territories.
All Union Territories exhibit an increase in literacy rates from 2001 to 2011, with the range of literacy rates improving from around 50–75% in 2001 to 60–85% in 2011.
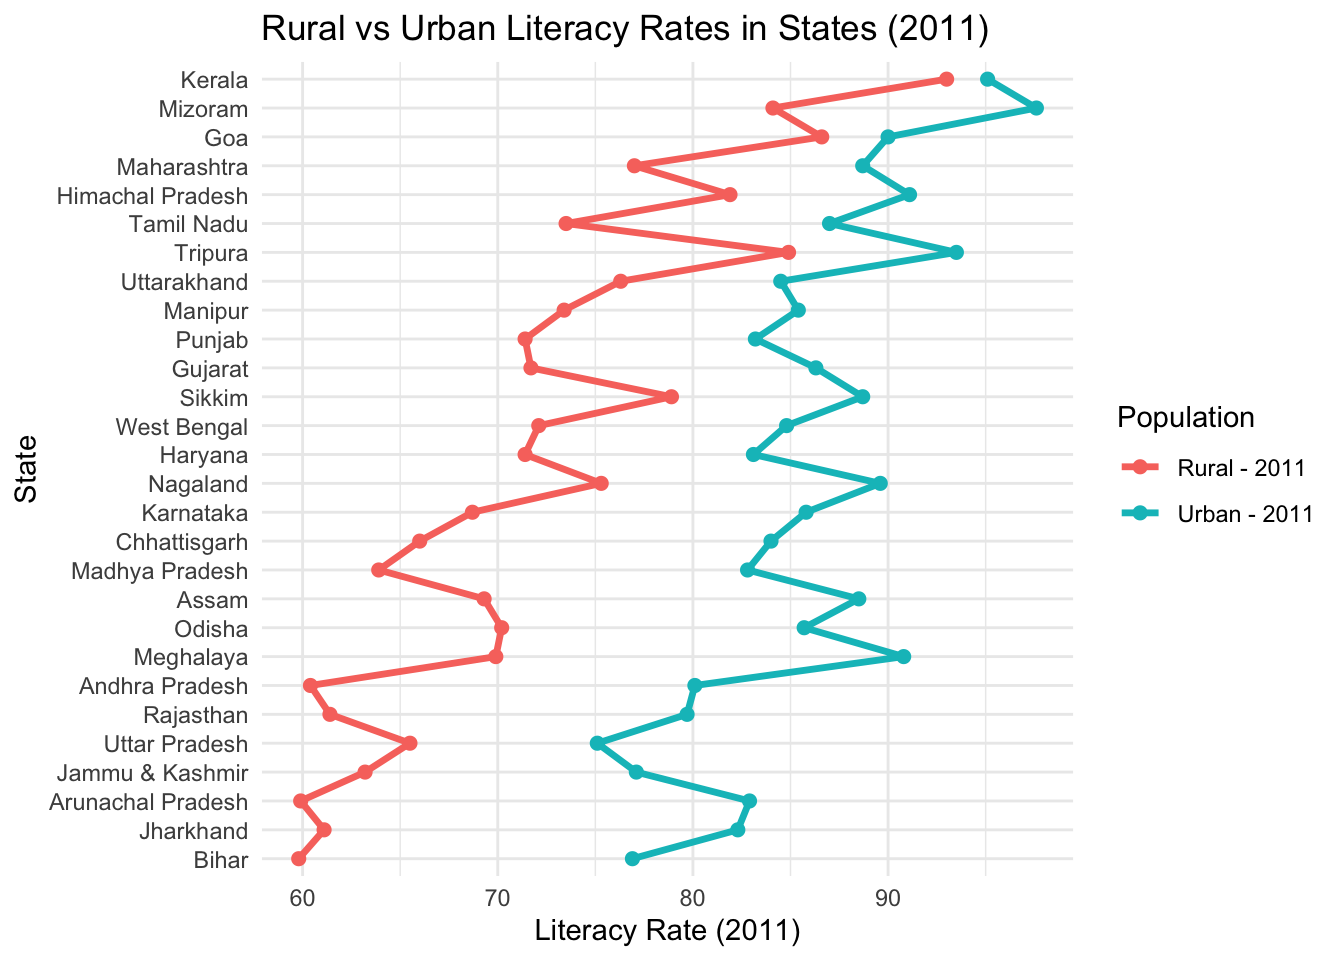
The line graph in Figure 3 visualizes the literacy rates in rural and urban areas of the states in India for the year 2011.
States with high overall literacy rates tend to have a narrower gap between rural and urban literacy rates, while the states with lower overall literacy rates show a wider gap in rural and urban rates.
The scale ranges approximately from 60% to 90% literacy, where the red line represents literacy rates of rural areas and the blue line represents literacy rates of urban areas.
States like Jharkhand, Madhya Pradesh, Andhra Pradesh, and Bihar have huge gaps between rural and urban literacy rates.
This might indicate that there are disparities in the literacy rates of urban and rural areas in these states.
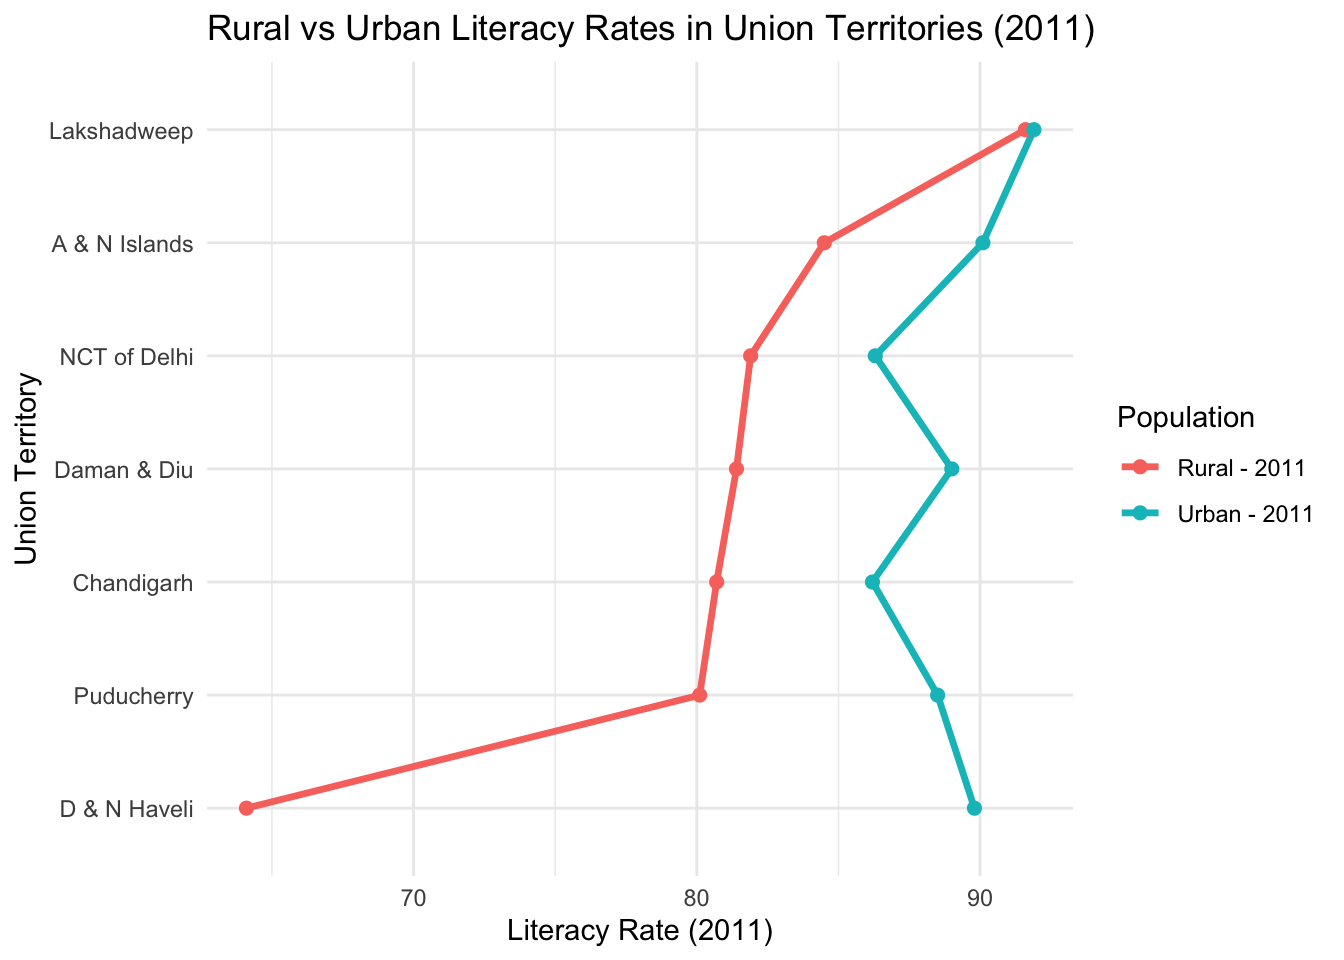
The line graph in Figure 4 compares the rural and urban literacy rates in Union Territories (UTs) of India for the year 2011.
When compared with the literacy rates in the states, union territories generally have fewer disparities in the urban and rural areas.
Lakshadweep has equal literacy rates in both rural and urban areas, while other union territories show a narrow gap in the literacy rates of rural and urban areas.
Surprisingly, Dadar and Nagar Haveli show a wider gap in the literacy rates of urban and rural areas, with a difference of more than 20%.
In Table 1, the states and union territories with the lowest literacy rates in rural and urban areas for the years 2001 and 2011 are shown.
Despite being at the bottom, all the states and union territories listed have shown improvement in both rural and urban literacy rates between 2001 and 2011. For instance, Bihar’s rural literacy rates increased from 43.9% in 2001 to 59.8% in 2011, while its urban literacy rate went from 71.9% to 76.9% during the same period.
There remains a notable gap between the rural and urban literacy rates in many of these regions. For example, Daman & Diu’s urban literacy rate in 2011 was 89.8%, significantly higher than its rural literacy rate of 64.1%. This highlights the persistent disparity in educational access between rural and urban areas.
Several states, including Andhra Pradesh, Jharkhand, and Rajasthan, have shown considerable improvements in rural literacy rates. For instance, Jharkhand’s rural literacy rate improved from 45.7% in 2001 to 61.1% in 2011.
This table demonstrates that although progress is being made in literacy development, the efforts to reduce the urban-rural gap are still ongoing.
| Country/ States/ Union Territories Name | Literacy Rate (Persons) - Rural - 2001 | Literacy Rate (Persons) - Urban - 2001 | Literacy Rate (Persons) - Rural - 2011 | Literacy Rate (Persons) - Urban - 2011 |
|---|---|---|---|---|
| Bihar | 43.9 | 71.9 | 59.8 | 76.9 |
| Arunachal Pradesh | 47.8 | 78.3 | 59.9 | 82.9 |
| Andhra Pradesh | 54.5 | 76.1 | 60.4 | 80.1 |
| Jharkhand | 45.7 | 79.1 | 61.1 | 82.3 |
| Rajasthan | 55.3 | 76.2 | 61.4 | 79.7 |
| Jammu & Kashmir | 49.8 | 71.9 | 63.2 | 77.1 |
| Madhya Pradesh | 57.8 | 79.4 | 63.9 | 82.8 |
| D & N Haveli | 49.3 | 84.4 | 64.1 | 89.8 |
| Uttar Pradesh | 52.5 | 69.8 | 65.5 | 75.1 |
| Chhattisgarh | 60.5 | 80.6 | 66.0 | 84.0 |
The analysis of literacy rates across Indian states and union territories based on the 2001 and 2011 census data reveals several important insights into the socio-economic development of the country. The overall increase in literacy rates over the decade signifies that policies and initiatives to promote education have had a positive impact. States like Kerala, Mizoram, and Goa continue to lead with high literacy rates, while states such as Bihar and Jharkhand, despite improvements, still lag behind in literacy development.
There is a noticeable disparity between rural and urban literacy rates, particularly in states with lower overall literacy rates. The rural-urban gap is wider in states like Jharkhand, Madhya Pradesh, and Bihar, indicating the need for targeted educational policies to bridge the gap between rural and urban education. On the other hand, states with high literacy rates tend to exhibit a narrower gap between rural and urban literacy, showing more uniform educational access across different regions.
Interestingly, Union territories, which are governed by the central government, generally demonstrate higher literacy rates and smaller disparities between rural and urban areas compared to states, which are ruled by local governments. This could suggest that central government policies are more effective and uniformly applied across all union territories, contributing to their higher literacy rates. In contrast, states, which enjoy more autonomy, may need to improve their local educational policies to achieve similar outcomes.
For instance, Lakshadweep has equal literacy rates in rural and urban areas, highlighting the success of central government policies in smaller regions. However, outliers like Dadra and Nagar Haveli show a significant gap in rural and urban literacy rates, indicating areas that still require focused attention.
In conclusion, while India has made significant progress in improving literacy rates, challenges remain in addressing the rural-urban divide, especially in states with lower literacy levels. Continued investment in education, particularly in rural areas, is essential to ensure equal access to learning opportunities for all sections of society. The findings suggest that states need to focus on improving their local policies, while the central government’s strategies for union territories can serve as a potential model for more effective literacy policies across the nation.
‘States and Union Territories of India’. Wikipedia, 15 Sept. 2024. Wikipedia, https://en.wikipedia.org/w/index.php?title=States_and_union_territories_of_India&oldid=1245872194.
‘Literacy in India’. Wikipedia, 7 Aug. 2024. Wikipedia, https://en.wikipedia.org/w/index.php?title=Literacy_in_India&oldid=1239146465.